Monitoring using Prometheus, Grafana & Cadvisor.

In this article, we will run a docker container and we will monitor and see the cpu utilization and other metrics in cadvisor, prometheus and grafana dashboard.
🎇 What is cadvisor
(Container Advisor) is an open-source tool developed by Google that provides container-level performance metrics. It is specifically designed to work with containerized environments, such as Docker. cAdvisor is used to collect, aggregate, and export information about running containers. This information includes resource usage metrics, performance statistics, and other relevant data.
In the context of Prometheus, cAdvisor serves as an exporter. An exporter in the Prometheus ecosystem is a component that collects metrics from a third-party system and makes them available for Prometheus to scrape. In this case, cAdvisor collects container metrics and exposes them in a format that Prometheus can understand. Prometheus then scrapes these metrics from the cAdvisor service at regular intervals.
🎇 What is Redis
Redis is an open-source, in-memory data structure store used as a database, cache, and message broker. It supports various data structures like strings, hashes, lists, sets, and more. Redis is known for its speed and flexibility, making it a popular choice for applications that require fast data access and caching. Additionally, it can be used as a message broker in distributed systems.
🎇 What is Prometheus
Prometheus is an open-source monitoring and alerting toolkit designed for reliability and scalability of systems. It is primarily used to collect and store time-series data, making it valuable for monitoring and analyzing the performance of various components in a system.
🎇 What is Grafana
Grafana is an open-source platform for monitoring and observability. It provides a customizable and interactive dashboard for visualizing data from different sources, including Prometheus. Grafana is widely used to create visually appealing graphs, charts, and alerts, making it easier for users to understand and analyze their system's performance.
✨ Steps-
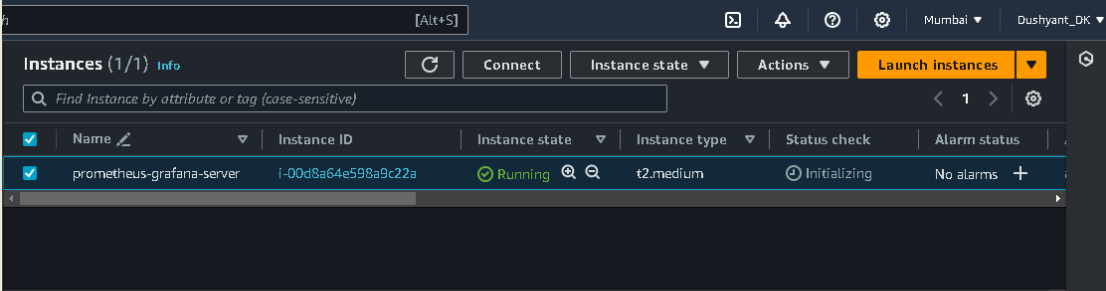
make a ec2 instance of t2.medium, create and allocate elastic ip to ec2.
Install docker and docker compose on ec2 instance.
make a directory prometheus.
install prometheus via document -wget command (check readme file https://github.com/dushyantkumark/prometheus-grafana-cadvisor-tutorial/blob/main/README.md)
make a compose file -- see the compose file in this repo- https://github.com/dushyantkumark/prometheus-grafana-cadvisor-tutorial/blob/main/README.md
create new container tetris-game, monitor this container.
this Docker Compose file helps you set up a monitoring environment using Prometheus and cAdvisor to collect and visualize container metrics. Redis is an in-memory data structure store often used as a database, cache, and message broker.
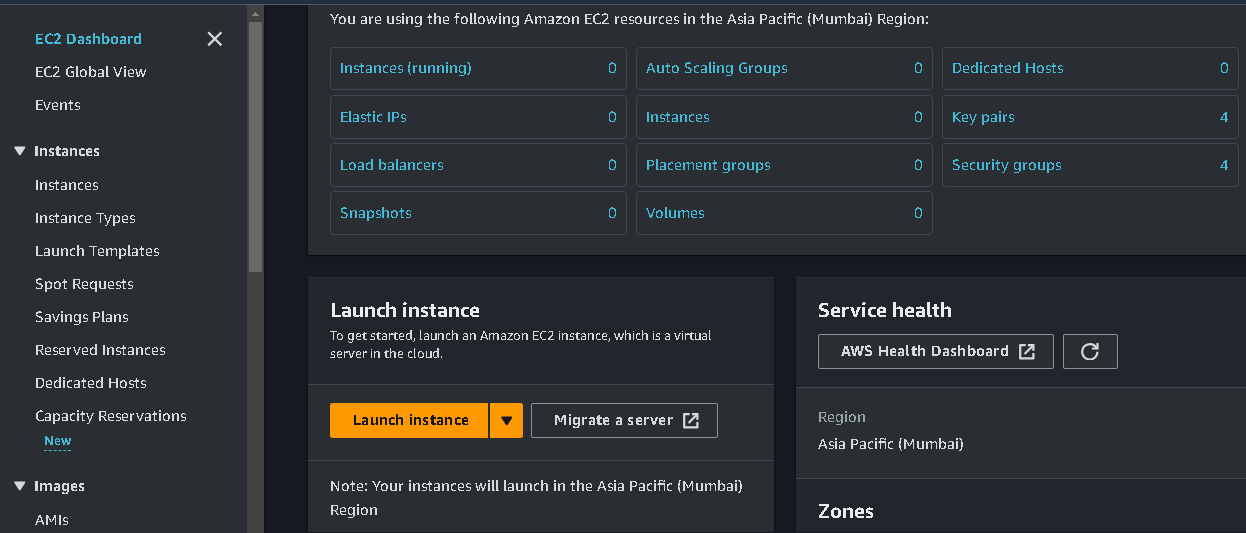
🎇 Launch Instance & EIasticIP
Click on the Launch instance option on the right side
Now click on the Connect Button when your instance is up and running Condition.
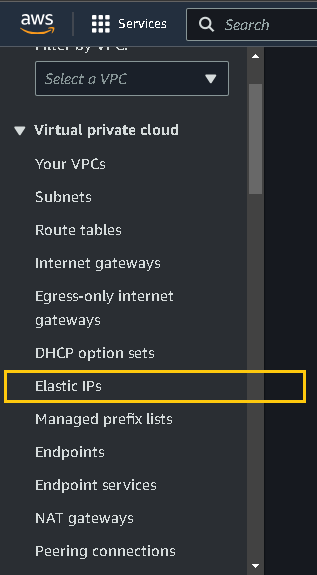
Create new eip that is static in nature.
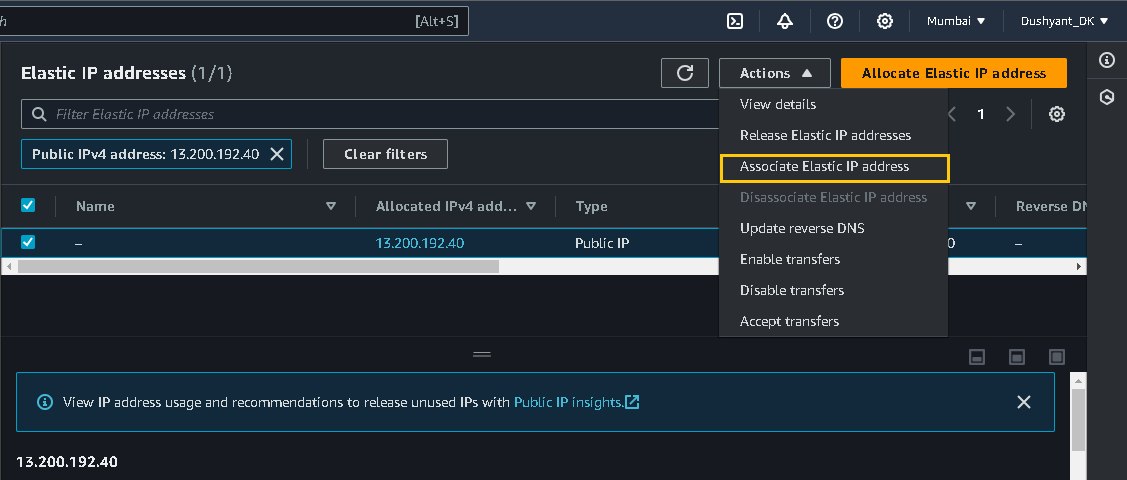
New eip attached to ec2 instance

🎇 Install & Configure Tools
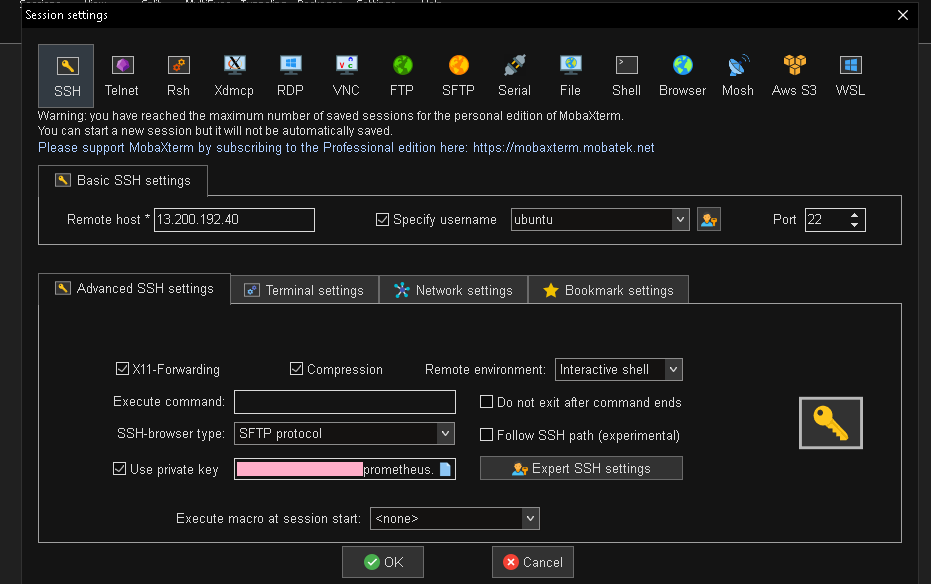
First ssh your ec2-instance.
Second make new directory prometheus, move into that directory and then install prometheus, docker compose. Create docker-compose.yaml file which contain container creation services.
pwd
mkdir prometheus
cd prometheus
pwd

Updating your ec2 instance.
sudo apt update
Install prometheus
Install docker.
sudo apt-get install docker.io -y
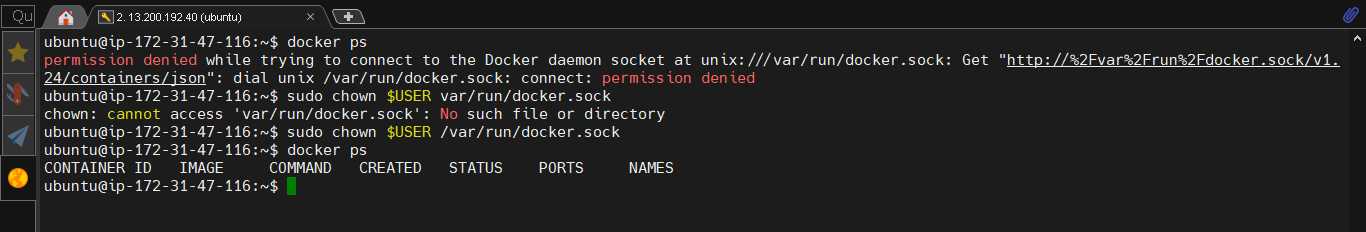
sudo chown $USER /var/run/docker.socket
docker ps
Install docker-compose.
sudo apt install docker-compose -y
download prometheus.yaml configuration file, using below command in prometheus directory.
wget https://raw.githubusercontent.com/prometheus/prometheus/main/documentation/examples/prometheus.yml
Create new yaml file called docker-compose.yaml in prometheus directory, docker compose file is used to define and run multi-container Docker applications.
This file is used to define and run multi-container Docker applications. In your case, it specifies three services: prometheus, cadvisor, and redis. Let me break down the configuration:
version: '3.2'
services:
  prometheus:
    image: prom/prometheus:latest
    container_name: prometheus
    ports:
    - 9090:9090
    command:
    - --config.file=/etc/prometheus/prometheus.yml
    volumes:
    - ./prometheus.yml:/etc/prometheus/prometheus.yml:ro
    depends_on:
    - cadvisor
  cadvisor:
    image: gcr.io/cadvisor/cadvisor:latest
    container_name: cadvisor
    ports:
    - 8080:8080
    volumes:
    - /:/rootfs:ro
    - /var/run:/var/run:rw
    - /sys:/sys:ro
    - /var/lib/docker/:/var/lib/docker:ro
    depends_on:
    - redis
  redis:
    image: redis:latest
    container_name: redis
    ports:
    - 6379:6379
Here's a breakdown of the key components:
Services:
prometheus: Runs the Prometheus monitoring tool. It exposes its web interface on port 9090 and depends on thecadvisorservice. It uses a volume to mount theprometheus.ymlconfiguration file.cadvisor: Runs Google's cAdvisor, collecting container resource usage. It exposes its web interface on port 8080 and depends on theredisservice.redis: Runs the Redis database server, exposing its default port 6379.
Images:
prom/prometheus:latest: The latest version of the Prometheus image.gcr.io/cadvisor/cadvisor:latest: The latest version of the cAdvisor image.redis:latest: The latest version of the Redis image.
Container Names:
- Each service has a specified container name (
prometheus,cadvisor,redis).
- Each service has a specified container name (
Ports:
- Port mappings are defined for each service (
9090:9090for Prometheus,8080:8080for cAdvisor,6379:6379for Redis).
- Port mappings are defined for each service (
Volume Mounts:
- Prometheus uses a volume to mount the
prometheus.ymlconfiguration file.
- Prometheus uses a volume to mount the
Dependencies:
prometheusdepends oncadvisor.cadvisordepends onredis.
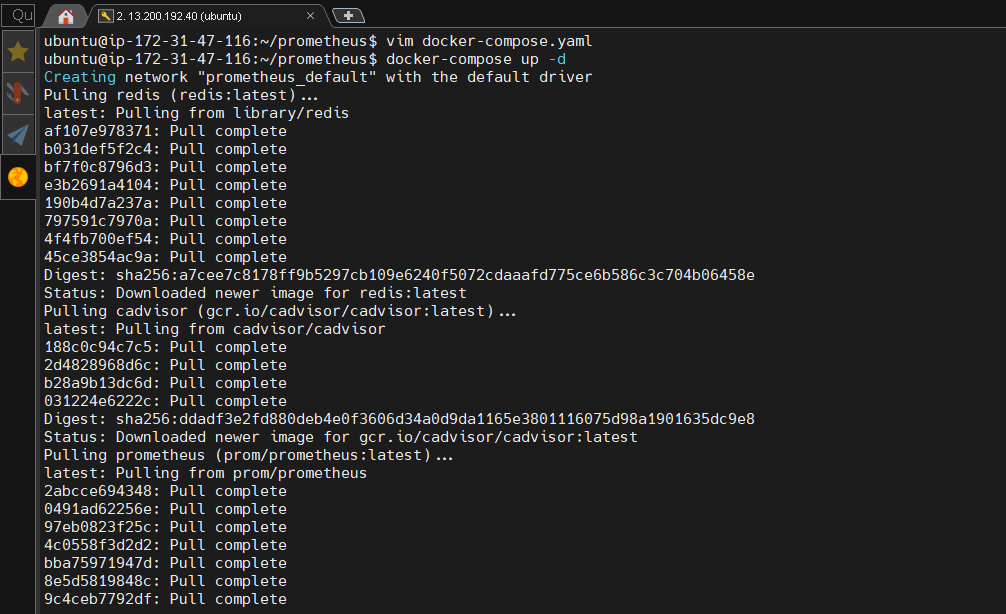
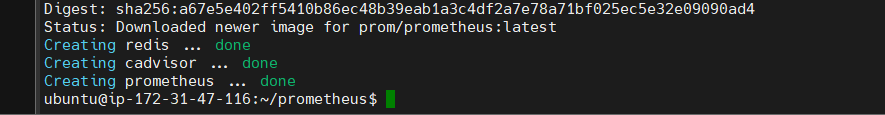
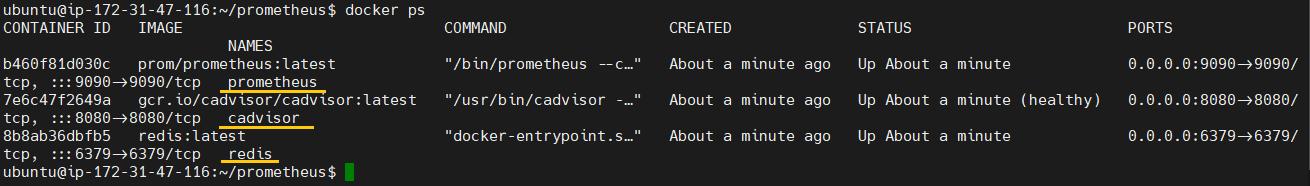
now its time to run multiple containers using single command, this will create 3 containers - cadvisor, prometheus and redis.
docker-compose up -d
check active running containers using command.
docker ps
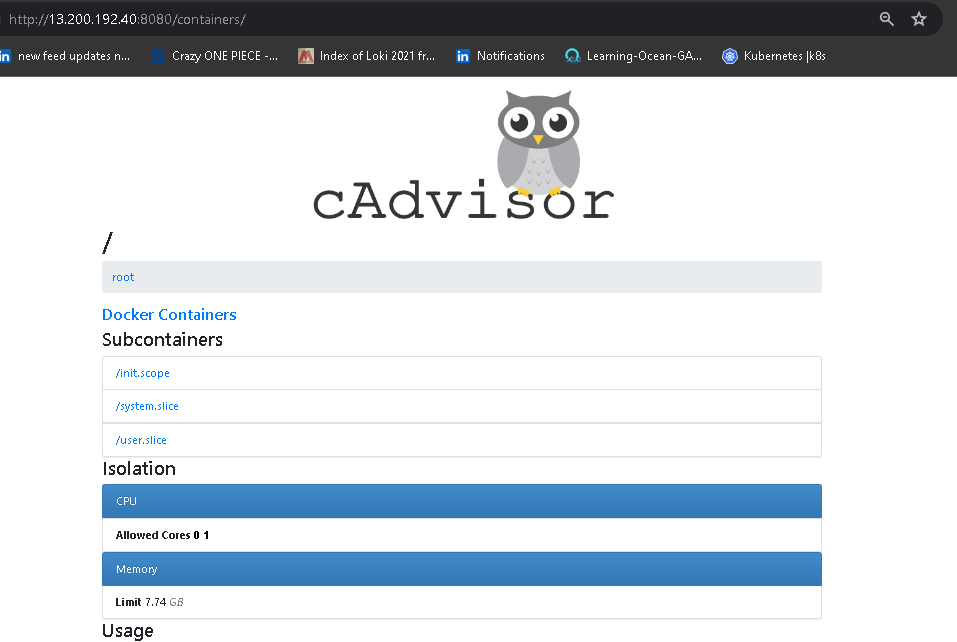
✨ cAdvisor, Prometheus Dashboard
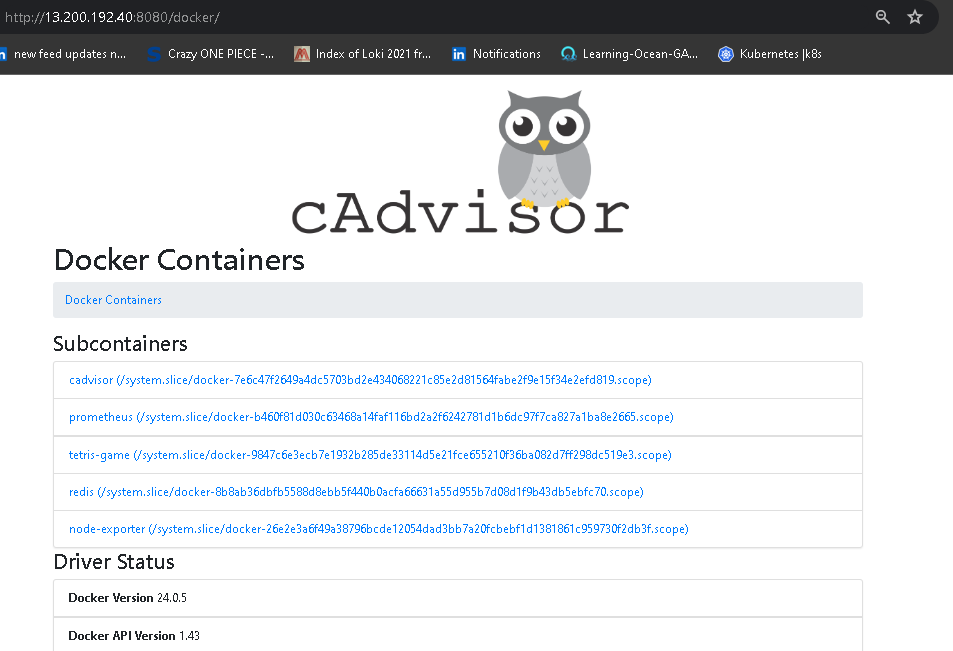
This is the output of cAdvisor, before getting this dashboard open some ports in security group.
cAdvisor - 8080
prometheus - 9090
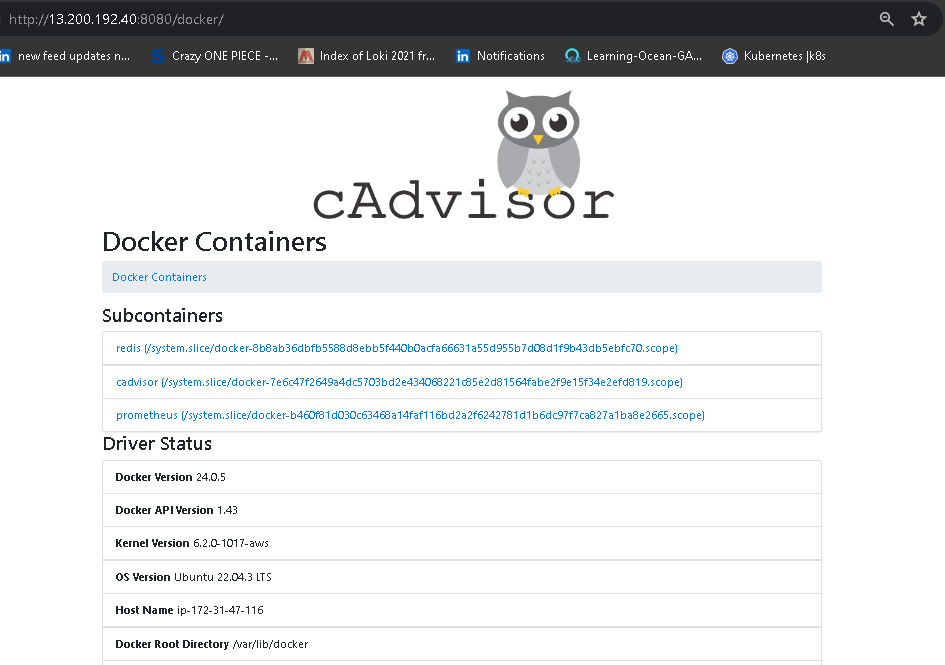
cAdvisor gui dashboard.
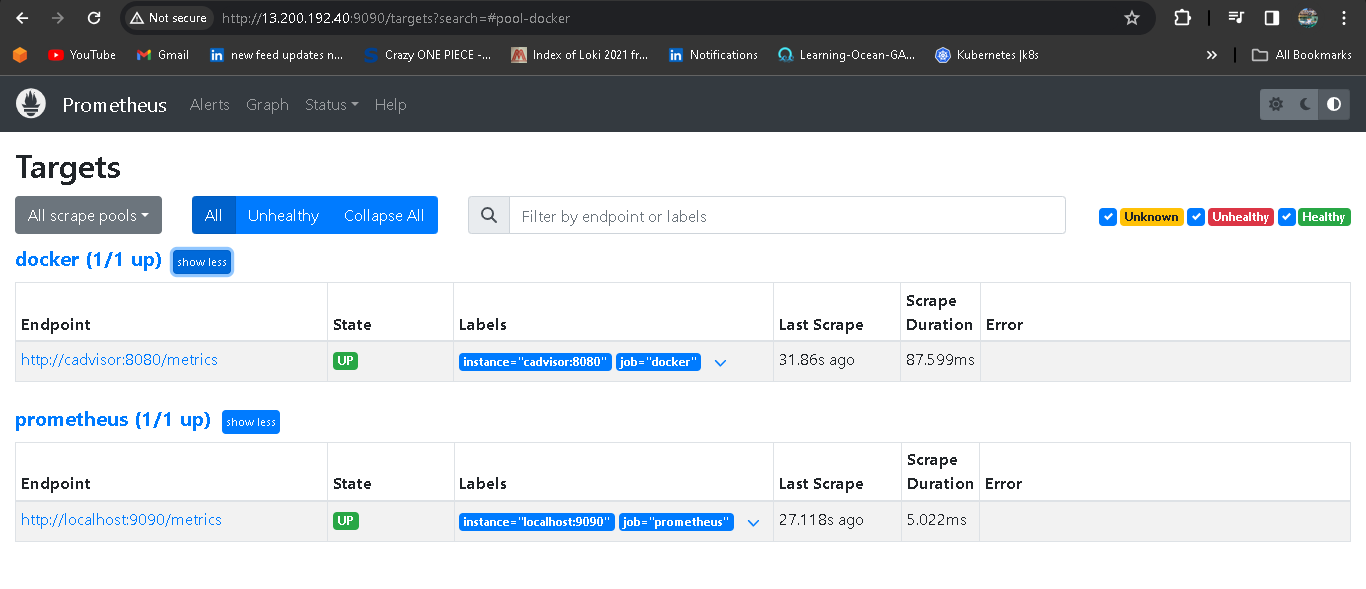
Prometheus gui dashboard.
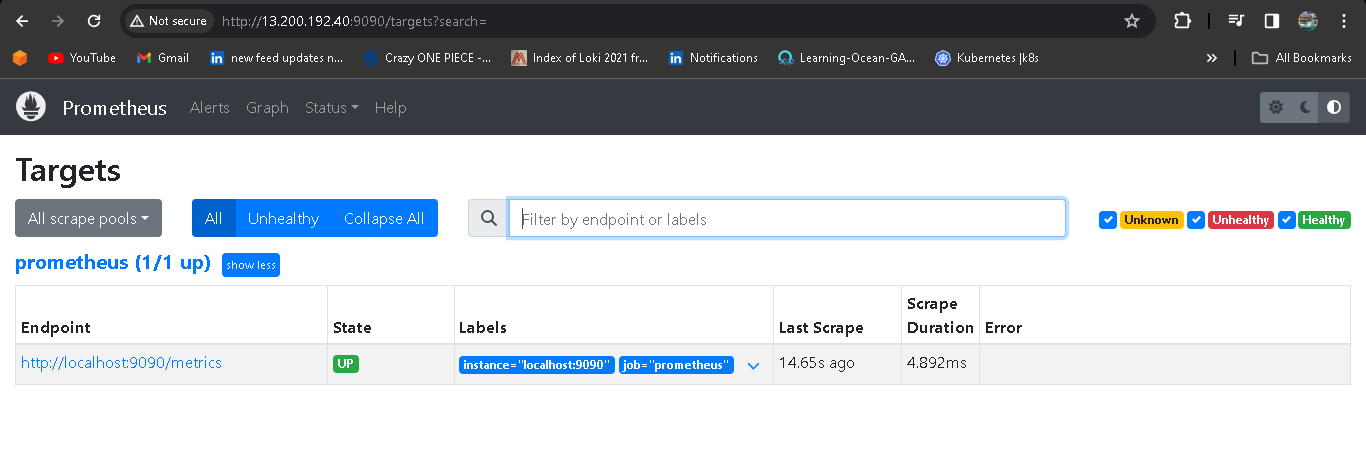
go to prometheus > status> target-
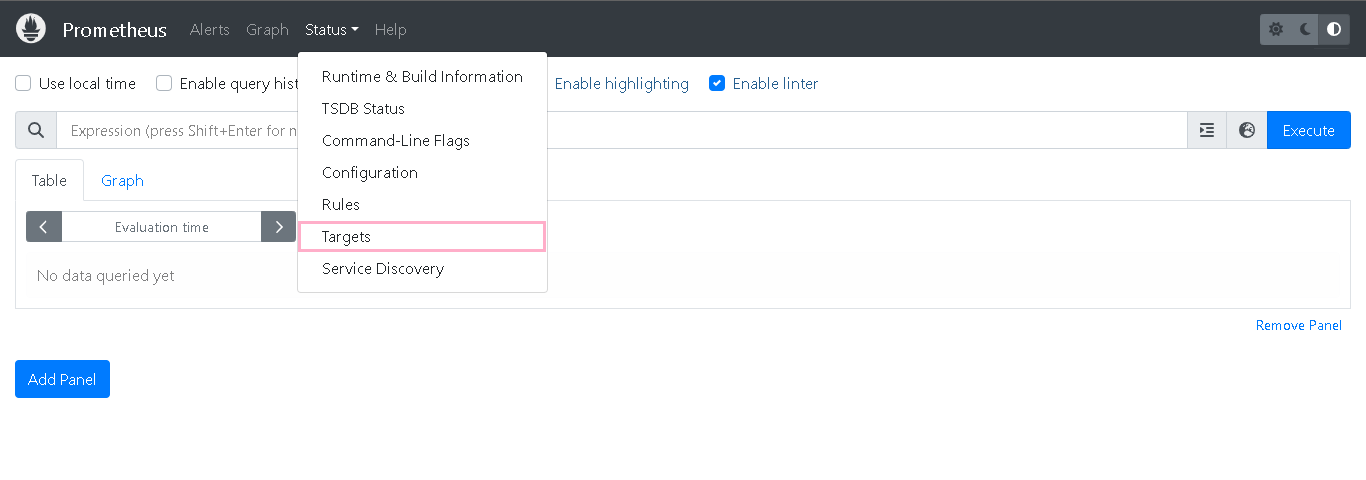
There is only one target "prometheus" at all right now , to add new target <> here, add the new job in prometheus.yml for docker containers.
✨ Adding new target for docker in prometheus
Now open prometheus.yaml file in prometheus directory and add new job_name with static_configs.
vim prometheus.yaml
- job_name: "docker"
  static_configs:
     - targets:
         - cadvisior:8080
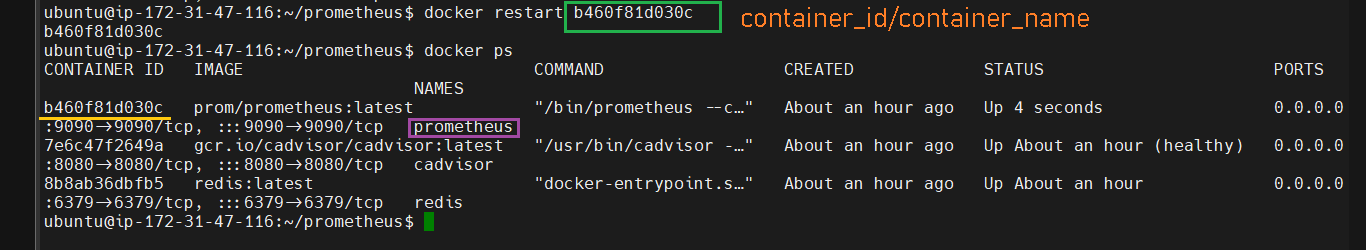
restart the docker container and see the prometheus gui now, automatically a target <>(docker) will be added there.
docker restart <container_name/container_id>
cAdvisor gui dashboard.
prometheus gui dashboard with new target "docker".
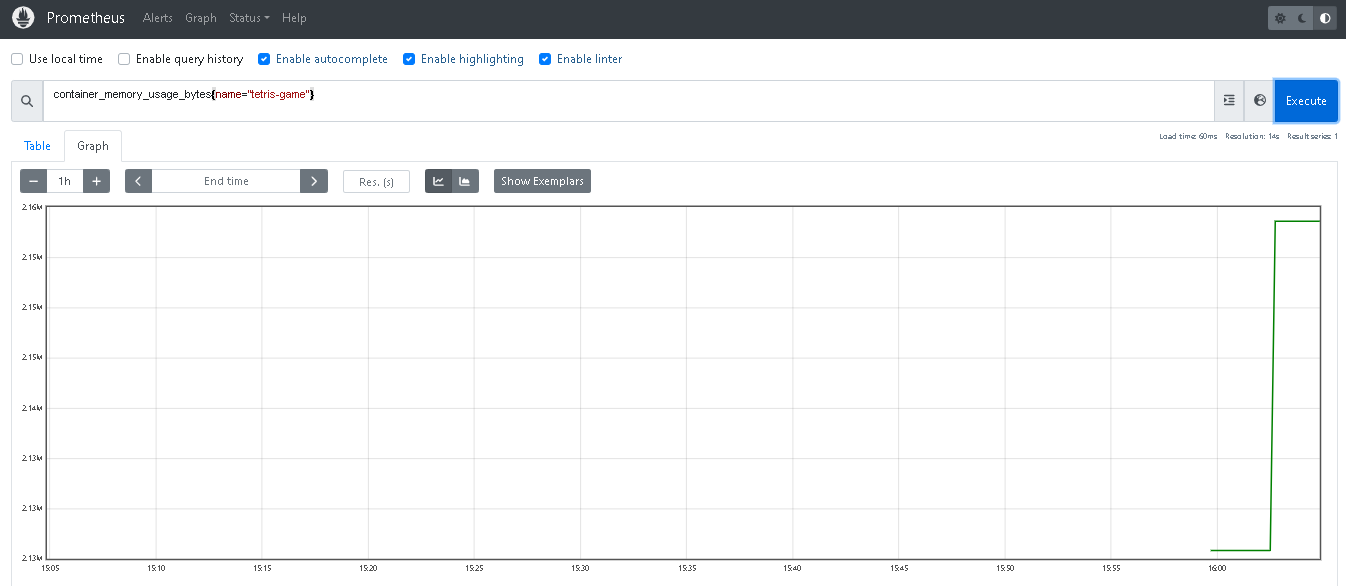
Now check docker metrics in prometheus.

Now test tje promQL
goto graph and hit the promQL -
rate(container_cpu_usage_seconds_total{name="redis"}[1m])

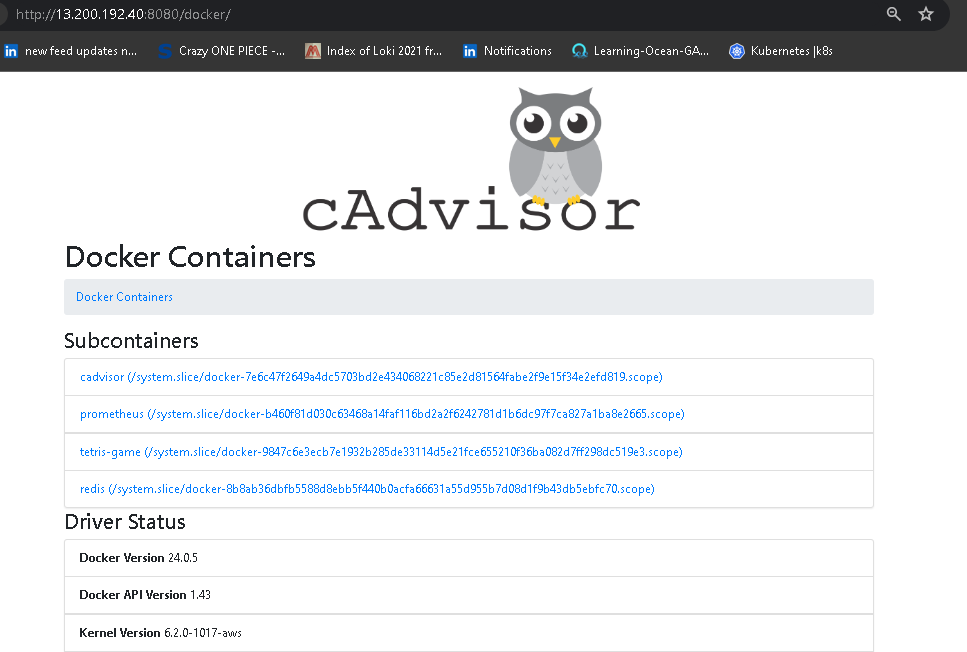
🎇 See the metrics of new docker container - tetris-game
✨ run the docker container directly in terminal
docker run -d -p 80:80 --name tetris-game dushyantkumark/tetris-v2:latest
docker ps

go to cadvisor gui and this new tetris-game container should show there also.
goto prometheus, and hit the promQL -
rate(container_cpu_usage_seconds_total{name="todo-app"}[1m]) 6
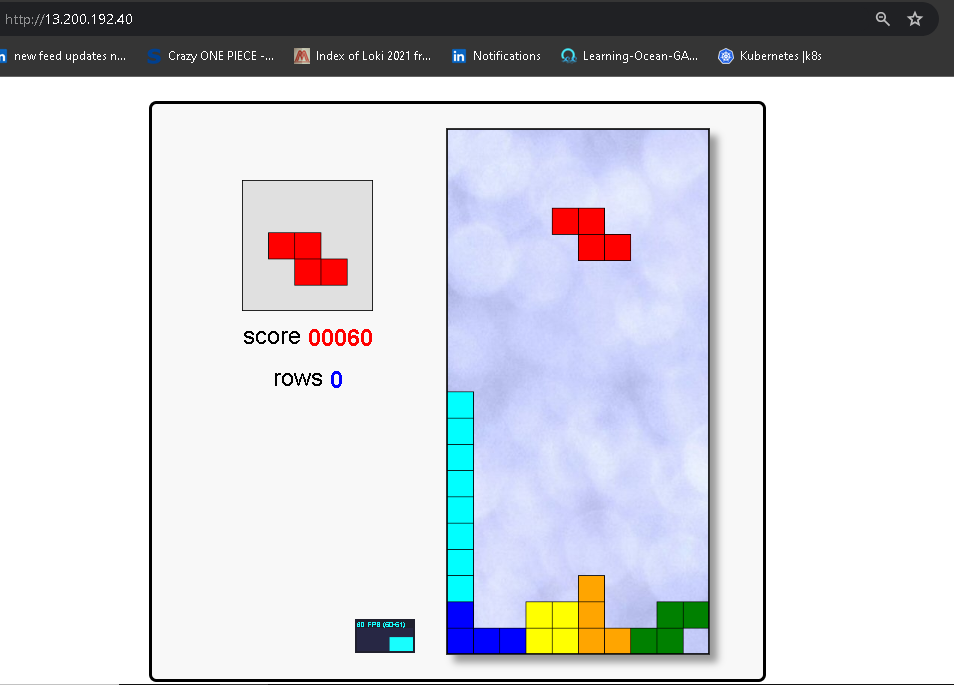
goto browser and access your gaming application.
<instance_public_IP:80>
🎇 Setup Grafana Dashboard
Follow below commands to install and configure grafana-server.
change directory cd /home/ubuntu
sudo apt-get install -y apt-transport-https
sudo apt-get install -y software-properties-common wget
sudo wget -q -O /usr/share/keyrings/grafana.key https://apt.grafana.com/gpg.key
#Stable release
echo "deb [signed-by=/usr/share/keyrings/grafana.key] https://apt.grafana.com stable main" | sudo tee -a /etc/apt/sources.list.d/grafana.list
# Update the list of available packages
sudo apt-get update
# Install the latest OSS release:
sudo apt-get install grafana -y
# Start grafana server
sudo systemctl start grafana-server
# Enable grafana server
sudo systemctl enable grafana-server
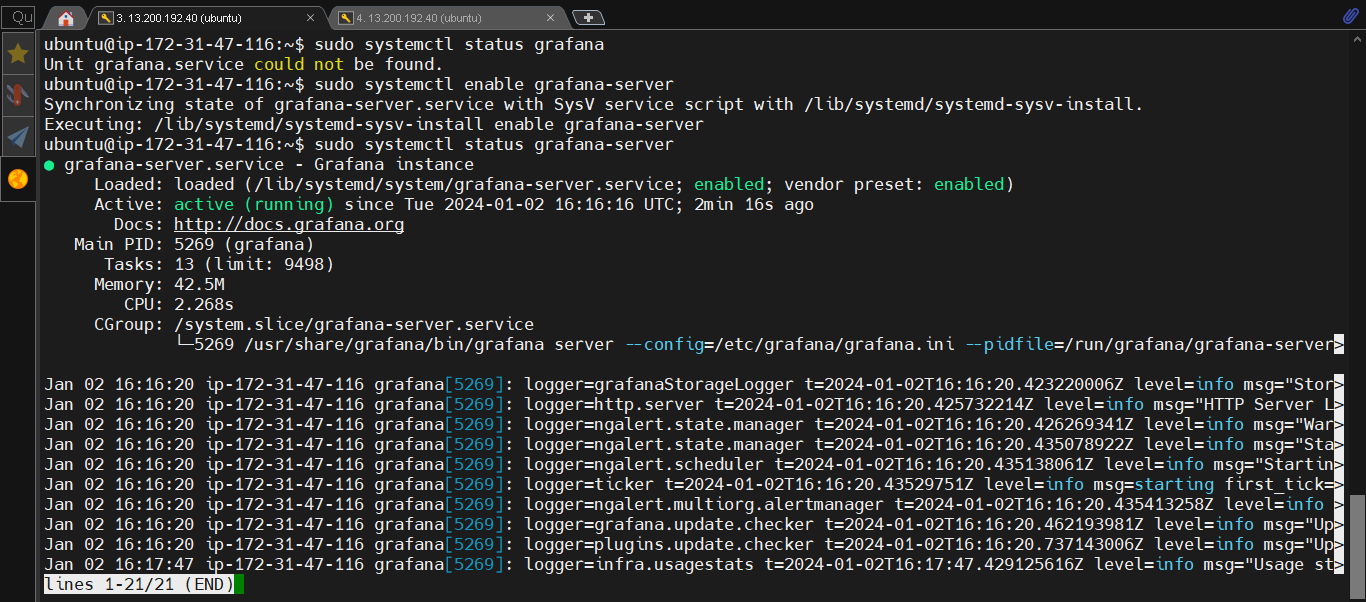
# Check status of grafana-serber
sudo systemctl status grafana-server
Add port number 3000 in security group.
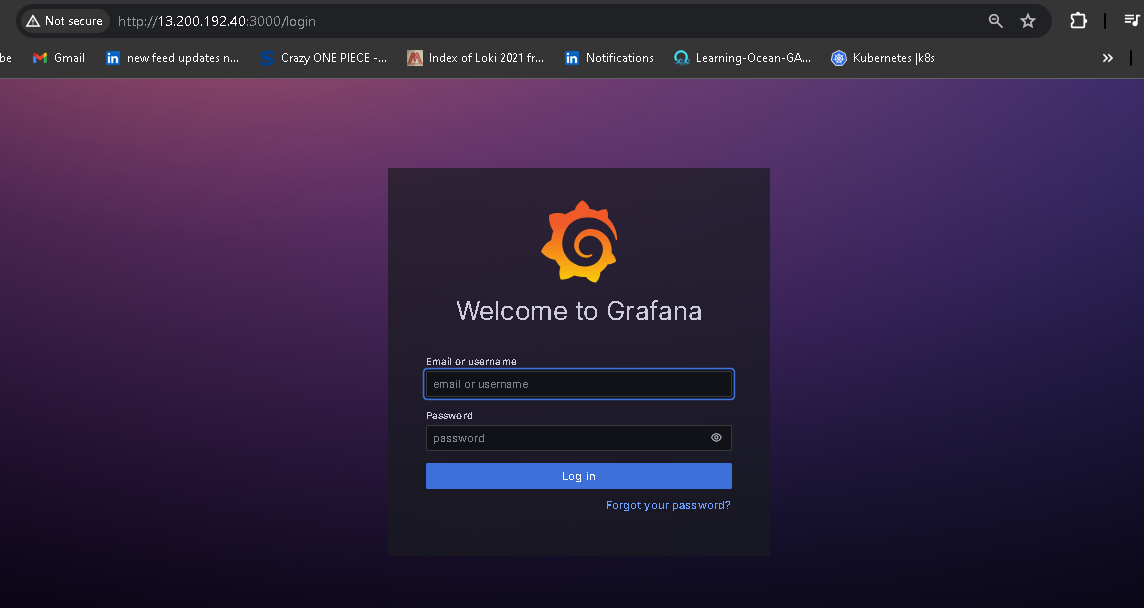
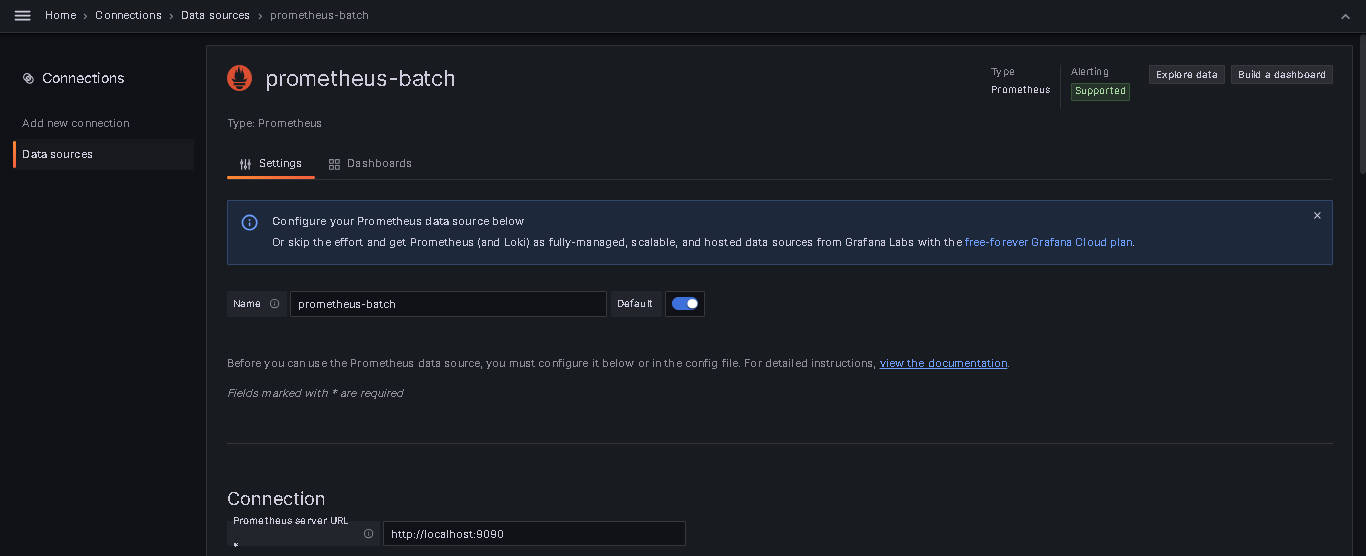
go to home -> connection -> data source -> prometheus : check prometheus connectivity.
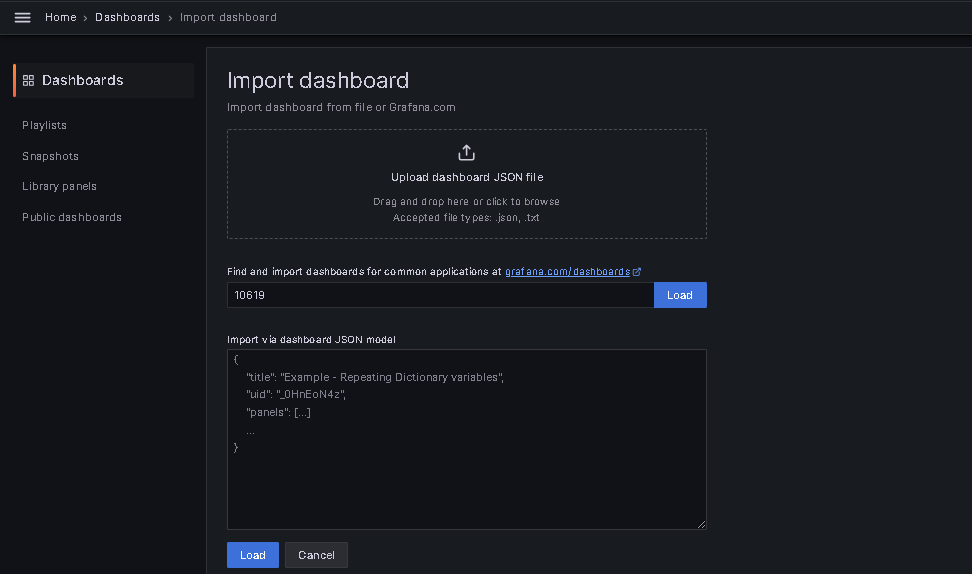
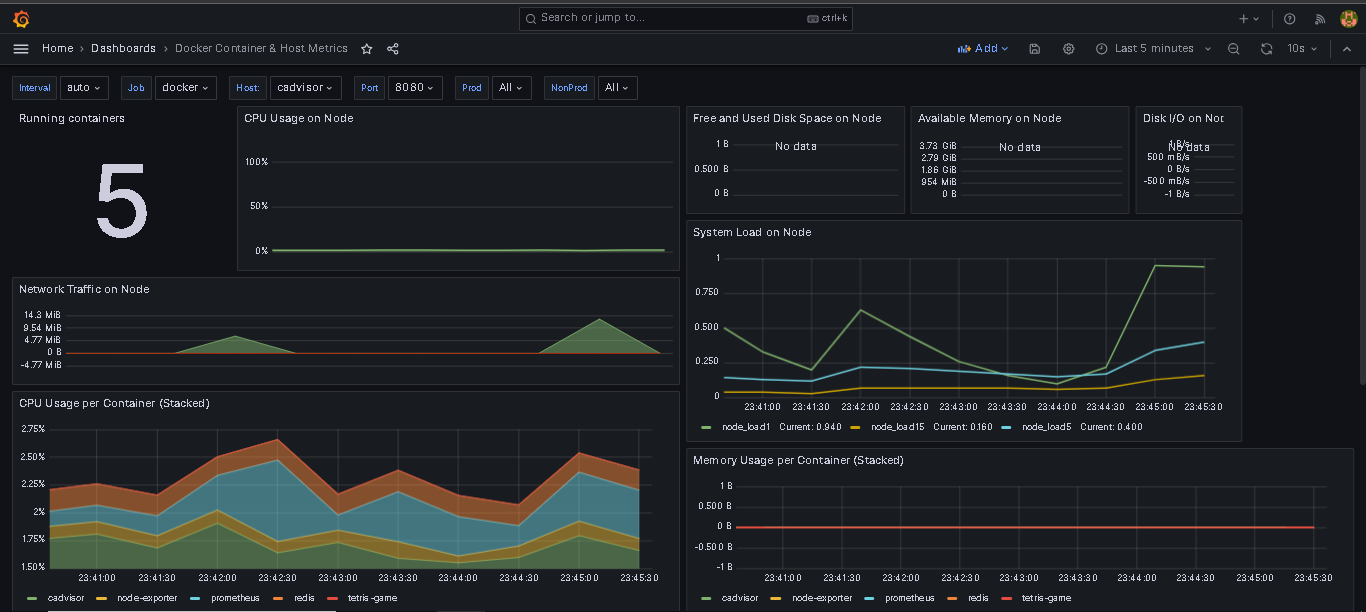
to see the docker dashboard - goto prometheus dashboard - search docker - copy the ID. (10619)
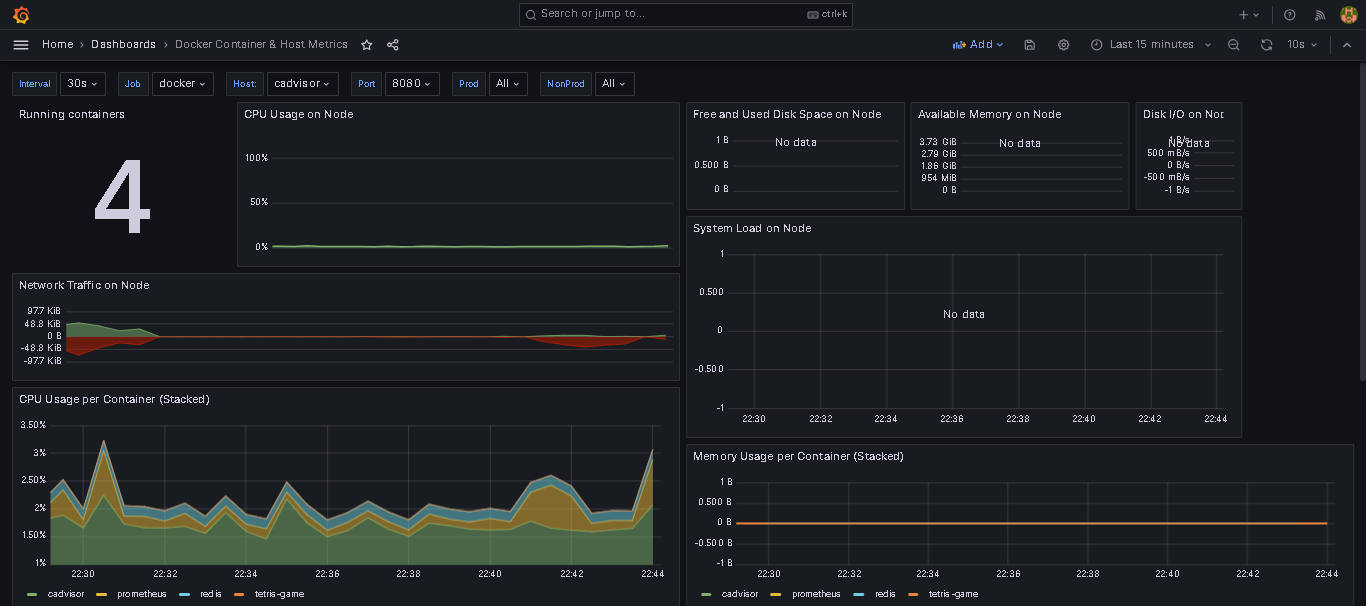
got to prometheus -> dashbaord -> add new -> paste the ID (10619) and select the prometheus server and hit enter. thts all now you will see the docker metrics in dashboard.
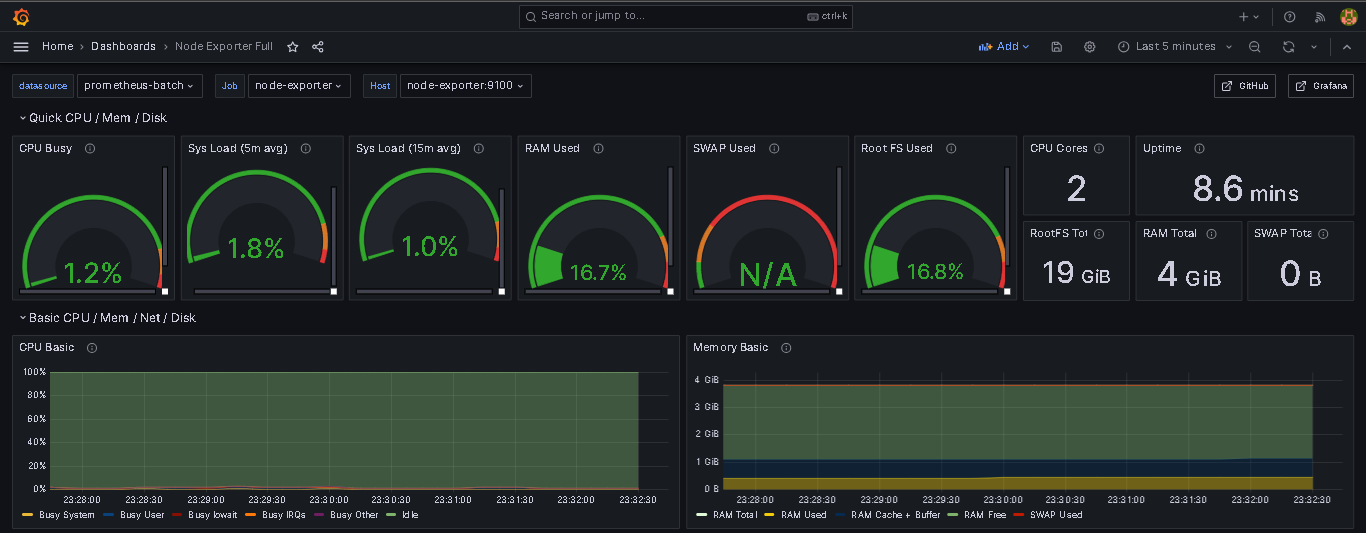
🎇 Setup Node Exporter
It serves as an agent that runs on the machine to be monitored, capturing information about the host's hardware and operating system metrics. These metrics can include details about CPU usage, memory usage, disk utilization, network statistics, and other essential system-level information.
Update docker-compose.yaml in prometheus directory, docker compose file is used to define and run multi-container Docker applications, this time is for "node-exporter".
version: '3.2'
services:
  node-exporter:
    image: prom/node-exporter:latest
    container_name: node-exporter
    restart: unless-stopped
    volumes:
      - /proc:/host/proc:ro
      - /sys:/host/sys:ro
      - /:/rootfs:ro
    command:
      - '--path.procfs=/host/proc'
      - '--path.rootfs=/rootfs'
      - '--path.sysfs=/host/sys'
      - '--collector.filesystem.mount-points-exclude=^/(sys|proc|dev|host|etc)($$|/)'
    expose:
      - 9100
  prometheus:
    image: prom/prometheus:latest
    container_name: prometheus
    ports:
    - 9090:9090
    command:
    - --config.file=/etc/prometheus/prometheus.yml
    volumes:
    - ./prometheus.yml:/etc/prometheus/prometheus.yml:ro
    depends_on:
    - cadvisor
  cadvisor:
    image: gcr.io/cadvisor/cadvisor:latest
    container_name: cadvisor
    ports:
    - 8080:8080
    volumes:
    - /:/rootfs:ro
    - /var/run:/var/run:rw
    - /sys:/sys:ro
    - /var/lib/docker/:/var/lib/docker:ro
    depends_on:
    - redis
  redis:
    image: redis:latest
    container_name: redis
    ports:
    - 6379:6379
There is only two target "prometheus" and "docker" at all right now , to add new target <> here, add the new job in prometheus.yml for docker containers.
Now open prometheus.yaml file in prometheus directory and add new job_name with static_configs.
vim prometheus.yaml
- job_name: "node-exporter"
  static_configs:
     - targets:
         - node-exporter:9100
Run following command:
docker-compose up -d

go to cadvisor gui and this new node-exporter container should show there also.
prometheus gui dashboard with new target "node-exporter".

- got to prometheus -> dashbaord -> add new -> paste the
ID (10619)and select the prometheus server and hit enter. thats all now you will see the docker metrics in dashboard.
- got to prometheus -> dashbaord -> add new -> paste the
ID (1860)for node-exporter.
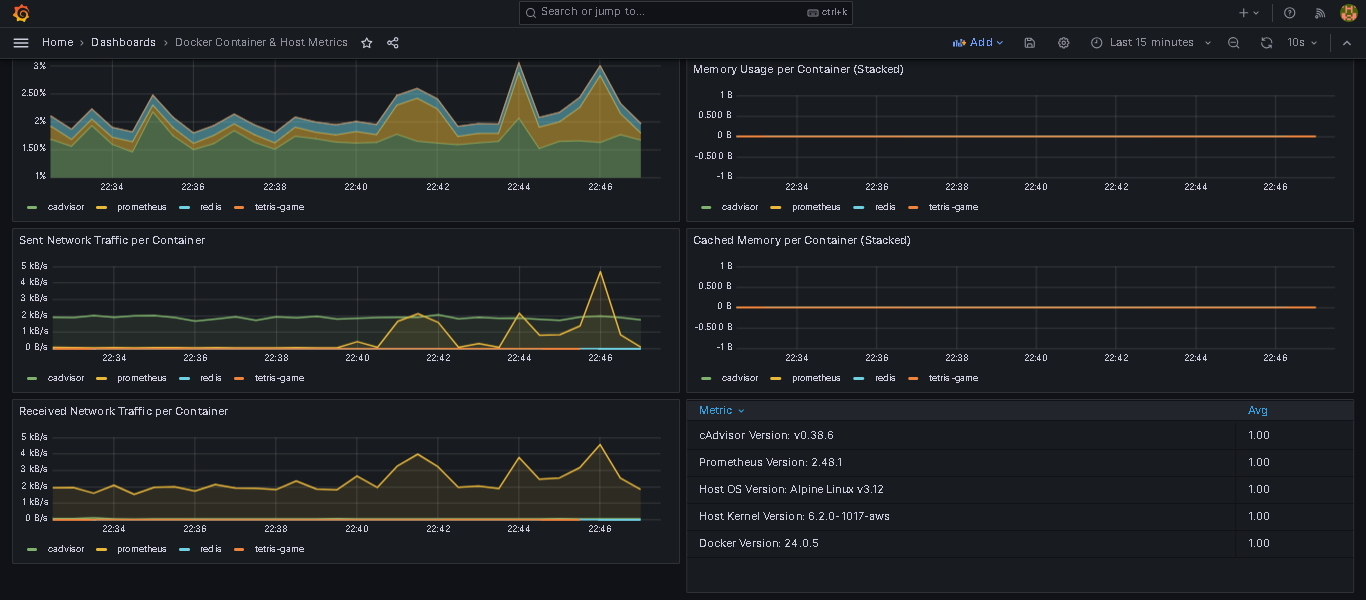
For real time monitoring, when image build process starts then we get fantastic live monitoring.

Thank you so much for taking the time to read till the end! Hope you found this blog informative.
\...................................................................................................................................................
The above information is up to my understanding. Suggestions are always welcome. Thanks for reading this article.
#docker #aws #cloudcomputing #Devops #grafana #cadvisor #prometheus #redis #TrainWithShubham #90daysofdevopsc #happylearning
Follow for many such contents:
LinkedIn: linkedin.com/in/dushyant-kumar-dk
Blog: dushyantkumark.hashnode.dev
Github: https://github.com/dushyantkumark/prometheus-grafana-cadvisor-tutorial.git


